R-value is a measurement, not a claim, and it comes from a specific test. Knowing the test explains why the number on the bag and the performance in your attic are not the same thing.
The test
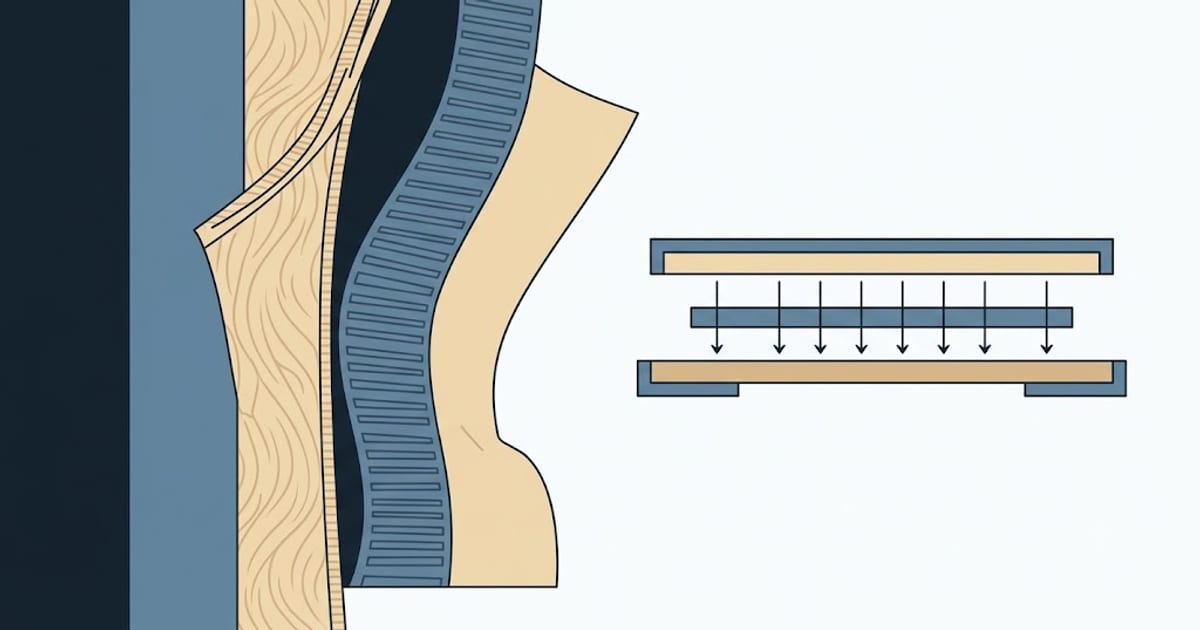
Two standard methods produce almost all published R-values. A guarded hot plate puts a specimen between a heated plate and a cooled plate, measures the electrical power needed to hold the hot side at a fixed temperature, and computes conductivity from that. A heat flow meter does the same thing faster using a calibrated sensor rather than measuring power directly.
Both hold the specimen at a mean temperature of 75 °F — hot side around 100 °F, cold side around 50 °F — under steady conditions, dry, flat, uncompressed, and new.
Every one of those conditions differs from an installed assembly, and three of the differences matter.
Difference 1: temperature
Insulation conducts differently at different temperatures, and fibrous materials get better as they get colder.
Fiberglass and cellulose typically gain a few per cent of R-value at attic temperatures in a cold winter compared with the 75 °F test point. That is the direction you want and it is small.
Foam boards can move the other way. Polyisocyanurate is the notable case: its R-value falls as it gets colder, sometimes substantially below freezing, because of how the blowing agent behaves. A polyiso board rated R-6 per inch at the test temperature can perform closer to R-5 on a cold roof — which is why it is often specified with a second material below it in cold zones.
Difference 2: age
Closed-cell foams are blown with a gas that insulates better than air. Over years, that gas diffuses out and air diffuses in, and the R-value drifts downward until it stabilises.
This is why foam products quote an aged or LTTR (long-term thermal resistance) value alongside the initial one. The aged figure is the one to design with. Fibrous materials do not have this problem — glass and cellulose have no gas to lose.
Difference 3: installation
The test specimen is flat, uniform, at its rated thickness, with no gaps. Real installations rarely are, and the losses are larger than people expect.
Compression. An R-19 batt squeezed into a 2×4 cavity does not stay R-19. It becomes roughly R-13 — the same material at less thickness.
Gaps and voids. A 5% gap in a batt layer can cost far more than 5% of the performance, because air moves through the gap rather than merely conducting.
Settling. Blown material can settle over years, losing depth and therefore R.
Air movement. Wind washing through a poorly baffled eave strips performance from the perimeter of an attic where the insulation is thinnest already.
Installation quality is graded in the trade as Grade I, II or III for exactly this reason, and the difference between Grade I and Grade III on the same material is worth more than a whole step of nominal R-value.
What to do with this
Design with the aged figure for foam, the nominal figure for fibrous materials, and assume you will get all of it only if the installation is genuinely good.
Spend on installation quality before nominal R. A well-installed R-38 outperforms a badly installed R-49, and it costs less.
Do not compare foam and fibre on per-inch R alone — the per-inch chart is true at the test point and is one of the places the numbers mislead. That comparison is worked through in R-value per inch by material, and the relationship between R-value and U-factor in R-value and U-factor.