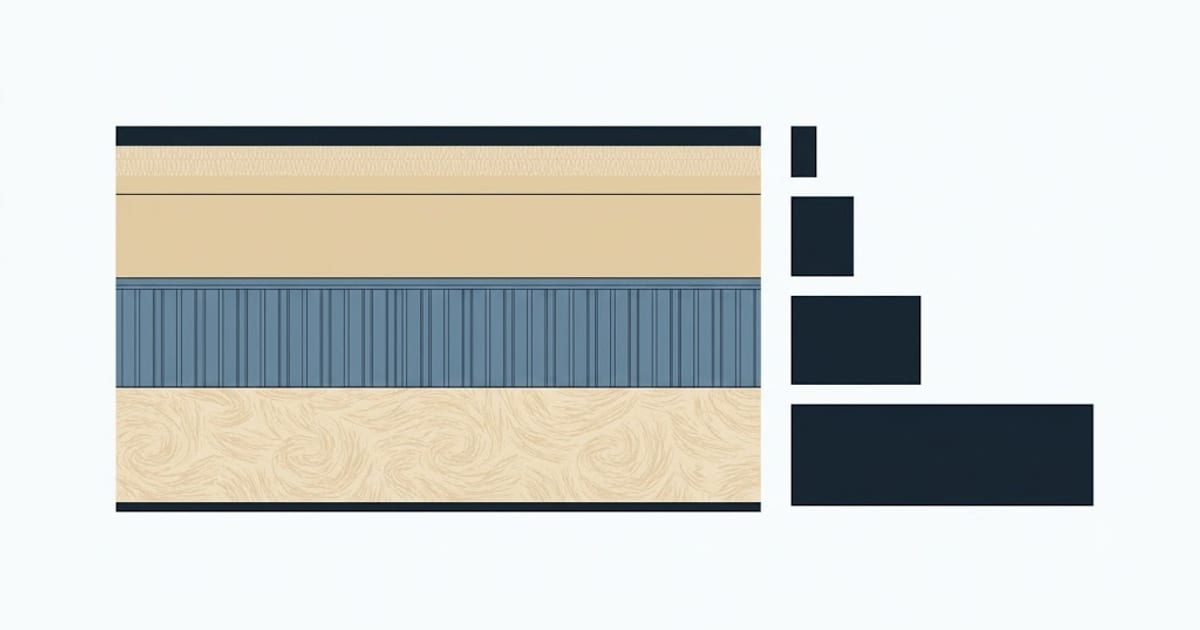
Annual saving from an insulation upgrade, in the heating season:
saving ≈ area × (1/R_old − 1/R_new) × HDD × 24 ÷ (efficiency × fuel energy) × fuel price
The 1/R_old − 1/R_new term is the one that matters. It is a difference of reciprocals, which is why the first improvement is worth far more than the last.
A worked example
1,500 ft² attic, R-11 to R-49, Zone 5 at 6,300 HDD, gas at 80% efficiency and $1.20/therm:
- ΔU = 1/11 − 1/49 = 0.0909 − 0.0204 = 0.0705
- 1,500 × 0.0705 × 6,300 × 24 = 15.99 million BTU
- ÷ 0.80 = 19.99 MMBTU = 200 therms
- × $1.20 = $240 a year
At $2,000 installed, simple payback is 8.3 years.
Now the same job in Zone 2 at 1,500 HDD: $57 a year, 35 years. Same house, same insulation, same cost — and one is worth doing while the other is not, on heating alone.
Why the second upgrade never looks as good
The same attic from R-38 to R-49 gives ΔU = 0.0263 − 0.0204 = 0.0059. That is one twelfth of the improvement, for a similar price per inch.
This is the general shape of every insulation decision, and it is why the answer is nearly always "find the worst assembly", not "add more to the best one".
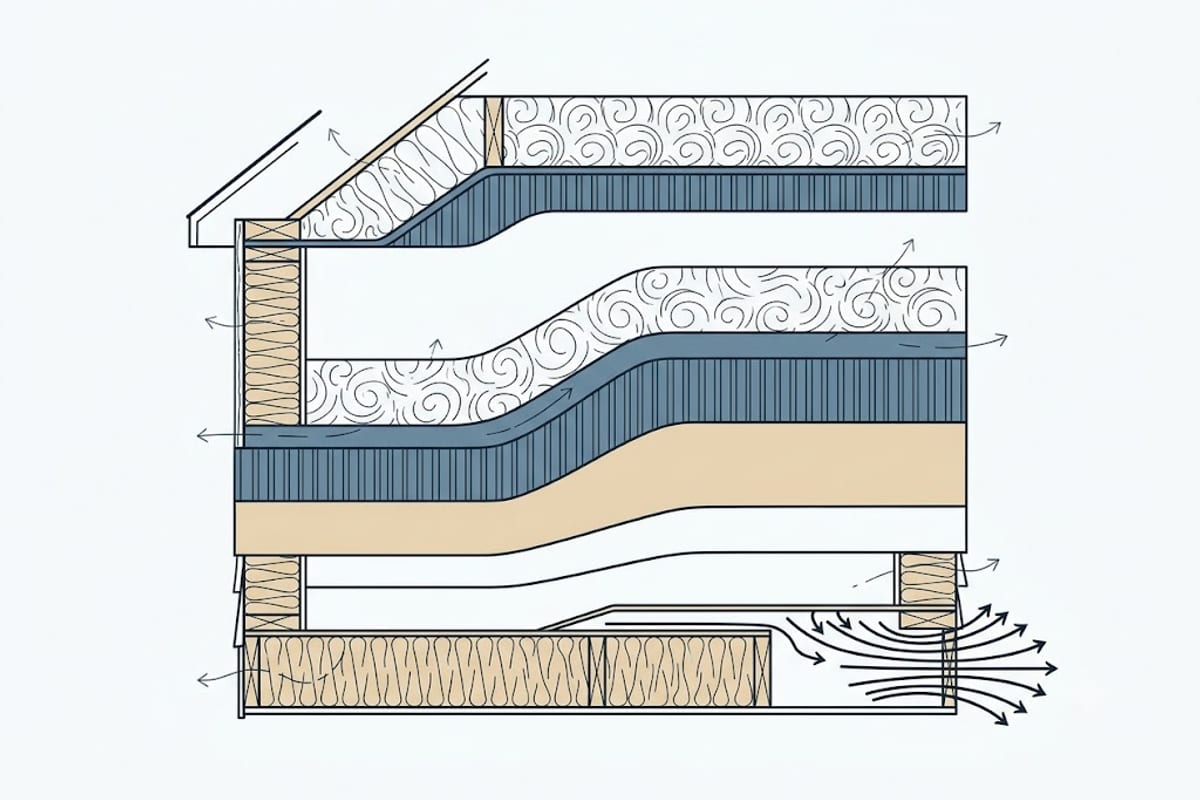
Three things the calculation omits
Cooling. In Zones 1 to 3 the summer saving often exceeds the winter one, and a heating-only payback badly understates the value. Add cooling degree days and the seasonal efficiency of the air conditioner.
Equipment size. A sealed and insulated house needs a smaller furnace and a smaller air conditioner. If a replacement is due anyway, the downsizing is cash on the day — sometimes several thousand dollars — and it never appears in a payback sum.
Comfort and durability. Cold walls make a room feel colder than the thermostat says, so occupants raise the setpoint. Insulation that keeps surfaces warm reduces that. And a warmer surface stays above dew point, which is a condensation and mould question rather than an energy one.
Fuel price is the biggest uncertainty
Payback in years assumes today's price for the whole period. Over the last two decades gas and electricity prices have both moved by factors, in both directions. A calculated payback of eight years is a statement about the present, not a prediction.
Rebates change the answer more reliably than fuel forecasts do. Utility and federal incentives frequently cover 30% or more of an insulation upgrade, and that comes straight off the numerator.
Payback is the wrong metric for something that lasts decades
Simple payback answers "when do I get my money back" and then stops. It says nothing about what happens afterwards, and insulation does not wear out.
An attic upgrade with an 8-year payback returns its cost eight times over a 50-year life at constant prices. A kitchen with a 0-year payback returns nothing. Payback ranks the two identically on the day of purchase and wrongly for every day after it.
Two better questions:
Lifetime saving. Annual saving × expected life. The $240-a-year attic job above returns roughly $12,000 over 50 years against a $2,000 cost.
Saving per dollar spent. $240 ÷ $2,000 = 12% a year, tax-free and inflation-linked, because the saving rises with fuel prices. Compare that with what the money would otherwise earn.
Payback is still useful for one thing: deciding order, when the budget is smaller than the work.
The order that pays
Ranked by return per dollar in a typical existing house, best first:
1. Air sealing. Cheapest per unit of heat saved, and it makes everything after it work properly. Attic penetrations, top plates, rim band, chases.
2. The rim joist band. A small area with an outsized loss, and it is insulation and air sealing in the same operation.
3. Attic, from whatever it is now to the zone target. The largest area with the biggest temperature difference and the easiest access.
4. Crawlspace or basement. Usually the worst-performing assembly in an older house, and often the one nobody has looked at.
5. Ducts, if any run outside the envelope. Frequently a larger loss than any of the above and almost always ignored.
6. Walls. Last, because opening them is expensive — unless the cladding is coming off anyway, in which case it moves to the top.
The pattern behind the list: fix the worst assembly, not the most visible one. The arithmetic for why is the difference of reciprocals above.